Energy management with light – identify consumption patterns and optimize them specifically
In many companies, lighting is a significant energy consumer, but is not yet systematically used in energy management. Modern, intelligent lighting in particular offers great potential for making consumption more transparent and for implementing savings in a targeted manner.
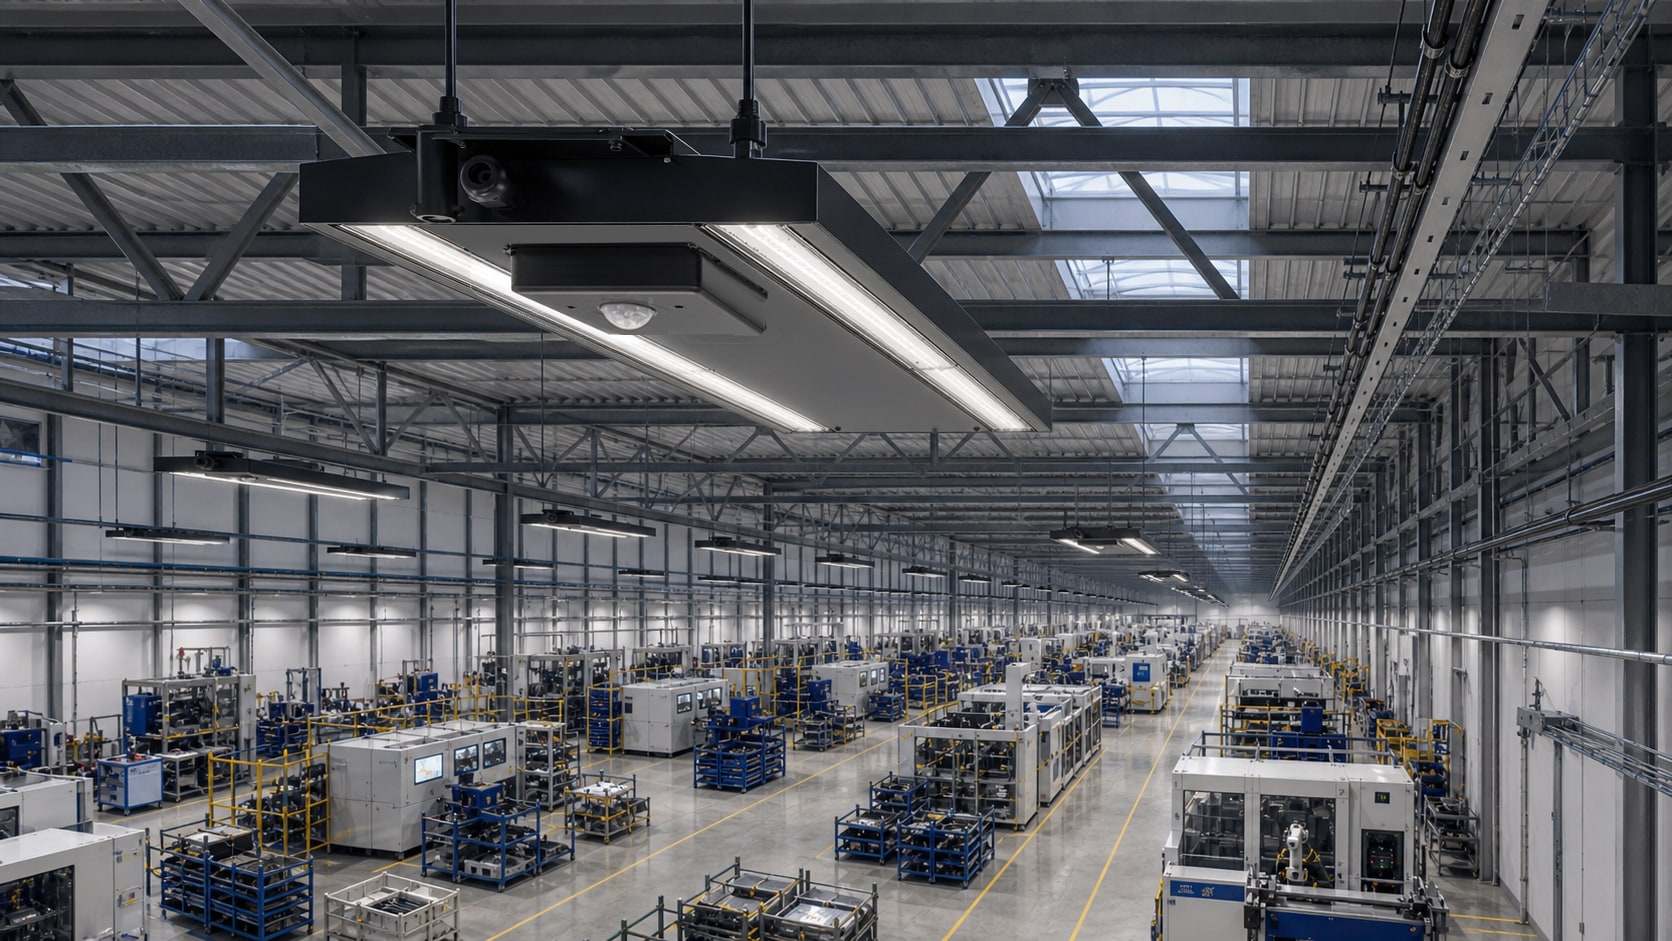
Energy & Space: Measurable. Comparable. Optimizable.
welight makes light an active component of the energy strategy – with measurement, control, and interpretable analysis. Through energy measurement per light, operating hour analysis, and central dashboards, consumption, usage patterns, and savings potential can be made visible. This creates a reliable data foundation for internal optimizations, sustainability goals, and energy-related reports.
Companies that want to save energy first think about production, compressed air or heat. Lighting is underestimated – although it accounts for 20–40% of the total electricity consumption in industry and commerce.
DownCurve Dashboard App
What the welight Downcurve app does
Energy & CO₂ savings
Display per light, building and location
Comparison with the baseline
Simple energy saving quick check
Optional: MID-certified measurements (for compliant proofs according to ISO 50001)
Automated monthly report by e-mail
Analysis & Evaluations
Operating hours per light
Diagnosis & condition check
Period: Day / Week / Month / selectable freely
CSV and Excel export
Automated safety light testing according to DIN EN 50172
Area management (incl. optional sensor package)
Detecting air quality and ambient noise
Real-time occupancy data for rooms and halls
Asset tracking (e.g., forklifts in logistics halls)
Integration
Integration into your energy management system
REST API for own dashboards and BI tools
MQTT for IoT platforms and SCADA
OPC UA for industrial control systems
BACnet / KNX for building automation and GLT
CSV/Excel export for manual reporting and audits
Important questions
Energy management with light
How does lighting support energy management?
Through measurement, control, and evaluation, lighting becomes a transparent measure of consumption that can be actively optimized.
Which data are relevant in this context?
Important factors include energy consumption per light source, operating hours, usage times, and location-specific evaluations.
Which companies are particularly interested in this?
Especially for companies with ESG goals, energy management, multiple usage zones, or connections to ISO-50001 processes.
No. The WeLight DownCurve app can be used completely standalone – with dashboards, exports, and automatic reports. If you already have an EnMS, we integrate via API.
By default, we use calibrated, highly precise measurement methods. On request, MID-certified measurements (Measurement Instrument Directive) are available – the highest level for compliant savings calculations.
Yes. The app exports CO₂ savings, consumption, and
Operational data in formats that are suitable for CSRD reports and
ESG ratings can be directly utilized.
Using the integrated sensor infrastructure (optional accessory), mobile assets – such as forklifts and roll containers – can be located in real time. The position is visualized in the app and can be exported as a CSV file.
Yes. The DownCurve app manages an unlimited number of locations
in a single instance. WeLight customers receive the
Setting up new locations is free of charge (special conditions apply).
On average 20–40% savings in energy consumption. With Enercon:
Uncontrolled LED: −69% consumption. Controlled LED: −93%.
The control system results in a good ROI of 3.0
For years, it has a very good ROI of 2.2 years.